Mathematics Developmental Continuum

Two processes are involved in using models and diagrams in all dimensions of mathematics: abstraction and generalisation.
Success in using models and diagrams in mathematical thinking depends on being able to abstract the key features from a situation. Models and diagrams represent certain aspects of reality. In the process of creating the diagram or model, much of the abstracting takes place. So, when a young child draws a person as a stick figure, or a window as a rectangle, they are abstracting from a far more complex reality. A similar process of abstraction takes place when a student makes a model or diagram to represent a mathematical situation. Processes of abstraction are also required when students interpret diagrams and models presented by the teacher to illustrate concepts.
A mathematical generalisation is something that is true across a wide range of different situations, numbers etc. Success in using models and diagrams to explain a generalisation depends on seeing that the model or diagram applies to many cases. The crucial step is that the model or diagram is seen as generalisable. Of course each diagram or model must illustrate a specific case. Success in using a diagram or model to explain a generalisation depends on students being able to see beyond that one case.
Before students learn to calculate formally with fractions, they can use models to make generalisations about fractions and explain their generalisations using these models.
For example, by modelling a fraction as part of a circle (see diagram below), this student explained why a unit fraction is smaller if the denominator is larger. This is a generalisation because it is true for all unit fractions.
| Examples: |
"I have shown a quarter of the first circle and a sixth of the second circle. To make a quarter, I divided the circle into 4 parts, which is fewer parts than to make a sixth, so the quarters are each a bigger fraction of the circle. So a quarter is bigger than a sixth. The same thing would happen with dividing the circle into more than 4 parts. They would always be less than a quarter."
Importantly, when the teacher talked with the student, he revealed that he could see the generality in this argument - there is nothing special about a quarter and a sixth - just that 6 is a larger number than 4. Therefore, proving that a unit fraction is smaller if the denominator is larger.
 |
This student also used the two rightmost circles to reason about the relative sizes of 'a whole with one part missing', for example why 3/4 < 4/5 < 5/6. Again this student realises that the specific cases that he has drawn show a general property. He knows that he could have shown the same general property by drawing other fractions.
"I have shown a quarter taken out of the first circle and a sixth taken out of the second circle. More of the circle has been taken away, so 3 quarters is less than 5 sixths. This would always work for any numbers. There is more left in the circle if it is cut into more pieces and one piece is taken away."
At the market there are seven cages of rabbits. Three cages have four rabbits in them and the other cages have 2 rabbits in them. How many rabbits are there altogether?
A good way for young students to begin this problem is to draw a diagram. Some students will begin by drawing rabbits and cages. Others will be able to abstract the significant features and draw a diagram more like this.
 |
Students who need to draw pictures of rabbits and cages may not understand that a diagram is not a picture but an abstract representation. It faithfully represents what is important to the problem, and not other things. In this case, it shows the numbers of rabbits and the numbers of cages. Only the numbers matter.
Abstracting is required for using and interpreting diagrams, as well as for making them. Students at this level should be able to explain what the dots and rectangles stand for (rabbits and cages) and how the diagram will help solve the problem.
Students have to be able to see underlying mathematical ideas expressed in diagrams and models at various levels of abstraction. For example, a key feature of even and odd numbers is that even numbers represent pairs, and odd numbers have 'one left over'. This can be represented in several ways:
Teachers can ask students to demonstrate how all of these ideas are related. For example, how does a diagram (such as the one below) illustrate the same idea as the students holding hands in pairs, pairing up counters and the arithmetic relationships? Students can also discuss different ways of making the diagram, and how these different diagrams represent the same mathematical idea. For the diagram below:
| Some even numbers | ||||||
| 8 | ||||||
| 12 | ||||||
| 4 | ||||||
| Some odd numbers | ||||||
| 11 | ||||||
| 7 | ||||||
| 1 | ||||||
Assisting generalisation
When we pair up students or counters, or use a diagram, we do it in specific cases. So it should be done with many different numbers so that students can see that the only thing that matters in determining even or odd is whether or not there is an 'odd one out'.
![]()
Examples of the types of tasks that would be illustrative of concepts using diagrams and models, aligned from the Mathematics Online Interview:
The processes of abstraction and generalisation are not easy. Diagrams and models can assist students to see generality and to generalise, but they bring their own abstractness.
The teaching strategies underlying the activities below are:
Using materials, diagrams and models, students should be encouraged to explain mathematical generalisations to others at an appropriate level. Making a good choice of models (diagrams or otherwise) is most important; the best models will naturally embody the important concepts. The choices of those below are based on research.
Activity 1: Odd and even numbers shows that quite young students can understand and explain mathematical generalisations when they use a simple model to interpret the concepts involved.
Activity 2: Empty number line describes a diagram that is useful to communicate about mental computation.
Activity 3: Equivalent fractions indicates how a linear model (a fraction wall) can help students to generalise understandings about fractions.
Activity 4: Multiplication of tens and ones offers a diagram that illustrates the distributive property, and helps students to make sense of this algorithm. It also relates to two-digit multiplication and to algebraic expansions in later years.
| Some even numbers | ||||||
| 8 | ||||||
| 12 | ||||||
| 4 | ||||||
| Some odd numbers | ||||||
| 11 | ||||||
| 7 | ||||||
| 1 | ||||||
The properties of odd and even numbers are very helpful when students are learning number facts. To establish these properties, students can argue from a simple model that various generalisations about sums, differences and products (in later years) are true for all numbers. In this activity the focus is on generalisations about addition and subtraction:
This activity establishes these generalisation by using a physical model first, then moving to diagrams which students can use to explain the generalisations.
Step 1. Establishing the number of students in a group as a model of even and odd numbers
In this case, a number is modelled by the students themselves. (An alternative is to use numbers of counters.) It builds on the preliminary work above which establishes how even and odd numbers relate to pairs of students holding hands and whether or not every student has a partner. Groups containing even numbers of students can hold hands in pairs. If the groups have odd numbers of students, there will always be one student left over without a partner.
Step 2. Using the physical model for addition
The next step is to use this representation to establish how even and odd numbers add together. Make two groups each with an even number of students, holding hands in pairs (e.g. 6 and 8). Discuss with students whether everyone would have a partner when the groups are brought together. Ask students what would happen if a different even number was used. Summarise the discussion on the board, stressing the generality of even + even = even.
Look at the other cases. For example, if two odd groups come together, the left-over students from each group can make a pair. By demonstrating this with different numbers of students, students can see that only the 'odd one out' matters, and therefore generalise to 'two odd numbers added together always makes an even number', so odd + odd = even.
Step 3: Using diagrams for addition
Discuss how the observations above can also be presented diagrammatically. For example, in the diagram below, the even numbers are in pairs and the odd numbers have 'one left over'. Students should explain how the diagram links with the previous model. The pattern then generalises through the use of several examples. The diagram may help with this step.
For example:
 |
By demonstrating this with different numbers , students can see that only the 'odd one out' matters, and therefore generalise to 'two odd numbers added together always makes an even number'.
Step 4. Differences between odds or evens
It is not obvious to students that the same rules that apply to adding also apply to subtracting. Again this can be demonstrated using different sized groups of students/counters. Through the use of several examples, students can see what happens. However, the intention is that they go beyond this observation of specific examples and use the model to see the generalisation.
For example:
Research shows that mental addition and subtraction is done successfully in different ways by different people. A useful learning and teaching strategy is to have students describe how they are doing the computation.
The empty number line is a simple device that has two purposes. Not only does it help the students to find the answer, it also assists them in explaining their strategies to others. In this case, a diagram is being used to assist explanations. Discussion of strategies contributes to the development of students' number sense.
Step 1: Ask students to perform a selected addition mentally, such as 27 + 15. (This example has been chosen as it jumps over two decades).
Step 2: Ask different students to explain what they did ‘in their heads’ to get the answer. (Focus on students who got the correct answer.) Students are likely to suggest multiple approaches.
Step 3: Illustrate the approaches by demonstrating the use of the empty number line. As much as possible, have students contribute to the demonstration. Here are a few possibilities.
 |
|
|---|
Other examples will include 'adding more than required and subtracting some' (particularly for adding numbers like 19, 29, etc.). There will be a greater variety in explanations of mental strategies for subtraction.
Note that the empty number line is a sketch, not a scale drawing. Spacing does not have to be exact, as it is a diagram to show thought processes.
As well as explaining thought processes, the intention is that the empty number line itself becomes a tool for thinking.
Some students have great difficulty in visualising fractions. These students fall back on poorly understood procedures rather than using approaches based on sound understanding. The fraction wall is a set of strips of the same length (representing the whole). It provides an excellent model for fraction understandings, including operations.
The activity below aims to demonstrate the use of the wall for the core activity: equivalent fractions. It focuses on making a generalisation about how equivalent fractions are related to each other by multiplication of numerator and denominator.
Step 1: Here is a diagram of a fraction wall. Students could make their own, or it could be provided. Even before cutting this into strips, many equivalent fraction lengths are clear, because the strips have been arranged into ‘families’.
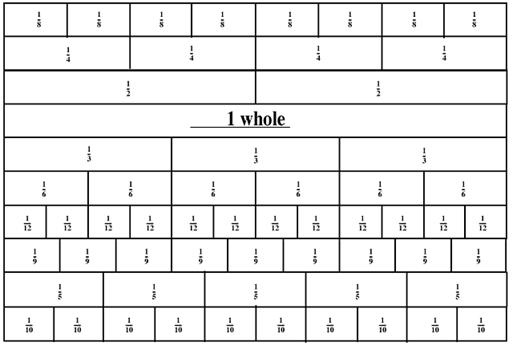
Step 2: The horizontal strips, each the same length, should be cut. This enables strips to be put side by side for comparison. Let the students search for many examples of equal lengths, such as 3 quarters is the same length as 9 twelfths.
Step 3: The next step is the generalisation. We are leading up to the idea of ‘sub-dividing’ a fraction and getting both 'more parts' (bigger denominator) and 'more of them needed' for the fraction (bigger numerator). You don’t have to physically do any cutting up, but the concept is useful; just put the two strips side by side.
Some good questions to ask students are:
“Suppose you had to make quarters from the halves strip. What would you do?” (Cut each half into two parts, to make four parts, called quarters.)
“Then how many of the quarters would you need to make one of the halves?” (You need 2 of them.)“Suppose you had to make sixths from the halves strip. What would you do?” (Cut each half into three equal parts, to make six parts, called sixths.)
“Then how many of the sixths would you need to make one of the halves?” (You need 3 of them.)
A few more similar examples should produce this generalisation: if you make the denominator some number times bigger, by cutting the pieces into equal parts, you will need that same number of times more pieces – so the numerator is also multiplied by the same number.
For example, to change 2 thirds to twelfths, cut each of the thirds into 4 parts. You end up with 2 thirds being the same as 8 twelfths (and 8 = 4 × 2).
When we perform a multiplication such as 13 × 5, most people use the distributive property of multiplication over addition. This means that we think of the 13 as (10 + 3) and multiply each part January 05, 2019