Mathematics Developmental Continuum


Students understand that contour lines on maps represent lines of constant height, and that all the points on a given line are at the same height. They begin to understand that the use of contour lines resolves the difficulty of trying to show three-dimensional information on two-dimensional representations
Students are able to talk about changes in height and can determine where the terrain is steep or flat. They can explain why contour lines at different heights cannot cross each other. (This is because all the points on a single contour line are at the same height. If two different contour lines were to intersect then the point at which they cross would have to be at two different heights simultaneously, which is impossible.)
Students also recognise the conceptual similarity between contour lines and other 'lines of constant attribute' such as isobars on a weather map.

Students realise that all the points on a given contour line are all at the same height. If they move from one contour line to another then there is a change of height. The closer the lines are the ‘faster’ the height changes, and thus the ‘steeper’ the terrain. The further apart the contour lines are, the greater distance over which height changes, and so the slope is gentler.
NOTE: some students may be able to ‘read’ contour lines in those terms (e.g. "it’s steep there because the contour lines are squished close") but may not be able to explain the connection between change of height and the relative change of distance. Students should also come to realise that there are contour lines between the ones that are actually drawn.
Students may notice that ‘water races’ (the man-made creeks in old gold-mining areas) and gravity-fed pipe-lines often follow contour lines. Similarly, train lines will often closely follow contour lines in order to reduce the amount of hill-climbing on the route.

Isobars are more difficult to understand than contour lines because pressure is harder to perceive physically than height. Whereas height can be seen, students may not be sure exactly what atmospheric pressure is because it is only evident through use of a barometer. Furthermore, changes in pressure occur on a fairly large scale, which makes it difficult to demonstrate the idea of isobars in the classroom, even if you do have a barometer.
|
Important note to teachers: Contour lines, together with isobars (lines of constant pressure) and isotherms (lines of constant temperature), provide us with a way of showing a third piece of information on two-dimensional paper. Position on the ground requires two dimensions (how far N-S and how far E-W), but things like height (how far up or down) require a third dimension, which we cannot do directly on a flat piece of paper. We could write a height value at every point, but that would make the map very cluttered, so what is done instead is to connect points that are at the same height. For clarity on the map, this is done only for chosen height values. A discussion with students of the difficulty of showing a third piece of information on a two-dimensional piece of paper, may help them appreciate the power of the idea of contour lines, and why we need such a solution. In the case of isobars, the third piece of information is atmospheric pressure (what the air pressure is at a particular location). |
It is essential that students have hands-on experience with three-dimensional models so that they can make the connection between the physical world and what is depicted symbolically on a map.
Activity 1: Potato Mountains uses readily available materials to directly link the physical situation with the symbolic situation.
Activity 2: Model it provides a template and instructions for a useful model that will assist students with their visualisation.
Activity 3: Match the Views provides students with practice visualising what is depicted by contour lines on a map.
Activity 4: Imaginary Bushwalks gives students further practice at interpreting scale, direction and contour line information from a realistic map.
Activity 5: Isotherms is a classroom activity that involves temperature measurement, which can be used to explain the more difficult concept of isobars.
Activity 6: Using Google Earth enables students to get a real picture of places on maps, and to see the real profiles that the contour information represents.
To help students appreciate that contour lines are lines of constant height, get them to mark contour lines on potatoes. You will need permanent markers and rulers, preferably rulers where the 0 is right at the very end (although some careful discussion could resolve any difficulties if there is a gap between 0 and the end). Choose washed potatoes with a few bumps and cut off the bottom so that it looks like a mountain that can sit flat on a piece of scrap paper.
NOTE: Don’t peel the potatoes, otherwise the permanent marker might get clogged with potato juice. Use the ruler and the marker to mark points around the potatoes sides that are 1cm off the ground. Join up all these points, to create the 1cm contour line. Repeat for 2cm: mark a few points and join them up, noting that this line will be parallel to the first. Repeat at 1cm intervals; the 3cm contour line is being created in the photo below.

Once students have drawn all the contour lines, they can view their potato from the side and from above. The view from the side shows that all the lines are parallel and equidistant. The view from above should show that the steep sides of the potato have contour lines that are close together, while more gentle slopes occur when the contour lines are further apart.
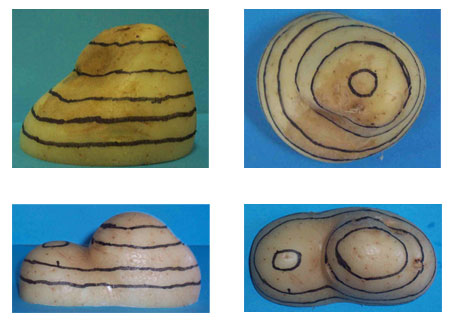
You can point out that what is seen in the view from above is what is drawn on a map: each contour line we see comprises all the points that are a certain height above some base level (usually sea level). Going from one contour line to another contour line involves a change of height.
You can make the connection to maps even more explicit by slicing one of the students’ potatoes along the contour lines. Before you start slicing, poke a hole down through the potato from the summit to the base, to help with the alignment (a knitting needle should work for this). Once sliced, you can trace around each piece in turn on a single piece of paper, using the hole to line up successive pieces over the one spot. The result will be a contour map of the potato. Discuss how the contour lines show the varying steepness of the potato mountain.
It is useful to have a good model of a mountain that you can demonstrate in the classroom. With a bit of effort you can build one using the template in ContourModel (PDF - 420Kb), which is also shown in the diagram on the left. Make several copies of the template, and glue the copies onto some thick cardboard (one or two layers of photocopy box) or polystyrene foam (as thick as possible, provided you can still cut it). Cut right around one of the contour lines and keep the resulting piece. Repeat this for a different contour line on each of the other copies. You can now assemble all your pieces to make a model, as shown in the diagram below (use the grid lines and the contour lines as a guide for putting it together accurately).


You can use this model with the sheet ContourProfiles (PDF - 423Kb) to help students visualise different views of the terrain determined by the contour lines. The sheet is reproduced below. Allow students to use the model and try different viewpoints, and see if they match the profiles given on the sheet. Select other viewpoints, and ask the students to sketch the profile using the map before confirming it with the model.

The resource sheet 'Match the View' (PDF - 455Kb) gives 5 small contour maps and 5 profile views, and asks students to match the pairs of corresponding maps and profiles. This activity should be conducted after students have had experience with the visualisation activities suggested in Activity 2.
[Answers: 1 matches D (very tall peak to the right of centre), 2 matches A (much taller peak on left), 3 matches E (the lowest mountain with only 4 contour lines), 4 matches B, 5 matches C (gentle slope to the right of the main peak before dropping sharply).]
A simple map with contour lines, grid, and a scale is provided in the resource 'Bushwalks' (PDF - 467Kb). Two tracks are marked on this terrain, and students are asked to imagine walking the tracks and give a description (either written or verbal) of each walk, paying attention to distance, direction and altitude.
NOTE: the second track passes over a mountain that has a depression at the summit (so that instead of continuing upwards to a peak, there is actually a dip at the top like a volcano cone). Students need to pay attention to the numerical values of the contour lines in order to notice this.
For more information: Scales on maps: Level 4.75. addresses concepts relating to scales and maps.
Sample Responses
Track 1. The walk begins heading south-east, through wooded bushland, rising slowly for about 4 km until a steep climb over about 1.5km brings you to a viewpoint on a ridge. Turning west, you head down steeply for about 2 km (maybe to a creek), and then climb back up for 1.5 km to the second view point. You then bear south for 2 km along a level section just below a ridge on the left. Then you climb up and over the side of a hill in about 2.5 km, dropping into a saddle between two peaks. Here you turn north-east, climb to the top of the peak which now appears ahead of you (the summit is reached after 1.5 km) and after climbing down, enjoy walking down a final gentle slope for another 5 km.
Track 2. Head north and north east up a very steep track leading to the rim of the crater and proceed inside. The centre of the crater is reached after 3 km from your start where you can enjoy a short break. Take the steep track to the east, out of the crater and down the other side (for about 1.5km). Head on a level path along the saddle between the crater peak and the smaller peak on your right, and continue walking around the second mountain for about 10 km, before the track turns east and drops steadily to your next campground.
It is difficult to help students appreciate what isobars show, because it involves understanding about air pressure and because the scale at which changes in air pressure can be observed is usually too large to demonstrate easily. As an alternative, the principle can be illustrated using isotherms (lines of constant temperature). You will need a heater, one or more thermometers (or electronic thermal probes) that can measure temperature in the range 15° to 50°, and some string. Set up a heater in the classroom, and let it run for a few minutes. Measure the temperature at a close (but safe) distance from the heater, say 1m above the floor. Station a student there holding one end of a string. Move the thermometer to a different position, but in such a way that the temperature does not change. Station a student at this second position, holding the string stretched between them. Then keep changing position without changing temperature. Station students at all these positions holding the string so that (in theory) at every point along the string the temperature is the same. The string shows an isotherm: a line of constant temperature. Now go to a new position further from the heater where the temperature is different. Get a new piece of string, and join up all the points where the temperature is the same as this second value. Repeat for a number of different temperature values. You should ask students to speculate on the shape of the isotherms before creating them. Once you have your isothermal map of the classroom you should then make the connection to isobars, which do the same thing as isotherms, but with atmospheric pressure instead.
Google Earth is a free internet service, which contains a wealth of geographic information. Students can use it at home, or at school, provided they have sufficient bandwidth. It takes a few minutes to download, install and learn how to use it. It is available from Google Earth (http://earth.google.com/).
NOTE: Google Earth requires a modern computer, around 40MB of disk space, and a fast internet connection.
Find a map of a natural area of interest to your class, which has significant changes of height. It can be somewhere local (e.g. the Mt Feathertop and Mt Hotham region of northern Victoria), or somewhere far away that is interesting (e.g. part of the Grand Canyon). Look at the map and its contours first, and draw the profiles of the area from several points of view. Note the mountains and the valleys. Now use Google Earth to get a photo of the area. There are 3 controls. One zooms in and out. The ‘compass’ in the centre changes the position from which you are viewing (e.g. north, south). The other changes the bird’s eye view to a side on view, stopping at any position in between. The profile of the mountains can be easily seen.
NOTE: the side-on views are calculated on your computer from geographic data about heights and from the data on the bird’s eye view photograph.