Effective & Efficient Use of a Graphics Calculator: 5.7
Supporting materials
- Related Progression Points
- Developmental Overview of Working Mathematically (PDF - 31Kb)
- Developmental Overview of Structure (PDF - 35Kb)
Indicator of Progress

At this level, mathematics learning and problem solving is enhanced when students have good technical facility with a graphics calculator. They are able to use features of the graphics calculator appropriate for Level 6 mathematics topics. Students also recognise the limitations of graphics calculator outputs.
Prior to achieving this technical facility students may not be able to choose and use appropriate graphics calculator features to solve problems. They may have limited ability to recognise limitations of displays and outputs independently.
Illustration 1: Importance of the viewing window
Students need to develop an awareness of the importance of setting an appropriate viewing window and that the selection can impact on the visual display of a graph. They need to recognise that the viewing window always shows only a part of the graph of a function.
Illustration 2: Limitations of graphical displays
The limitation of displays due to the pixels available for graphing can lead to misleading representations of graphs of functions. For example, points may be joined by lines rather than smooth curves. This can cause difficulties for students who may not be able to anticipate the shape and key features of a graph.
Illustration 3: Lists and tables are different
Students need to recognise the different purposes of tables and lists for some graphics calculators. A table is usually linked to a function whereas lists usually have data that is entered and then students do something with the list eg produce a scatterplot, fit a regression curve or find summary statistics etc. Lists are not directly linked to what is entered as the function to be graphed.
Illustration 4: Numerical displays and rounding
Students need to know that graphics calculators work numerically. Even though they work with a very large number of decimal places, rounding errors can sometimes be important. For example, sometimes an output which should be zero may be given as a very small number close to zero, and vice versa. They should be familiar with different ways in which their calculator outputs numbers, depending on the mode setting.
Teaching Strategies
These activities aim to promote efficient and reflective use of graphics calculators. Learning how to use the tools of mathematics has always been an important part of learning mathematics. Understanding the display limitations of a graphics calculator or computer graphing program is critical in interpretation of both graphical and numerical outputs.
The relevant teaching strategies include discussion of intriguing examples, exploring limitations of the machines and setting challenges for classmates.
Students will generally learn technical aspects of the particular graphics calculator they are using in the context of learning the relevant mathematics, rather than in special lessons. However, there will be occasions where teachers devote parts of lessons to teach specific technical skills (e.g. teaching of entry syntax). There will also be a few specific lessons that highlight important features of the technology, as in the activities below.
Each brand of graphics calculator will have both advantages and limitations. It is important to incorporate examples that demonstrate the quirkiness of the brand of graphics calculator being used into discussions.
Activity 1 Setting viewing windows alerts students to the need for careful consideration of the viewing window to produce a graphical display showing important features of a graph.
Activity 2 Limitations of graphical displays explores the importance of understanding the effect of pixilation on a graphical display.
Activity 3 Tables and lists look similar but work differently raises awareness of the differences between tables and lists.
Activity 4 Numerical displays and rounding errors helps students develop awareness of the way that a graphics calculator displays and works with numbers.
Activity 5 Match this picture provides a puzzle task that highlights the effect of the viewing window on the visual appearance of a graph.
Activity 1: Setting viewing windows
Students need to develop awareness that the default viewing window may not always show all key features of a function. As well as being able to decide on an appropriate viewing window, students must also use a range of inbuilt features, such as zoom features, to find an appropriate viewing window. A certain level of technical facility is required to set a viewing window and to use the zoom features of a graphics calculator. These generic skills will need to be developed regardless of the brand of graphics calculator being used.
Viewing window to show all key features of the graph of a function
To emphasise the importance of selecting an appropriate viewing window, discuss the need for a graphical display to show all key features of a function and what these might be.
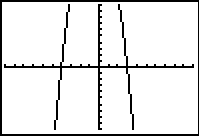
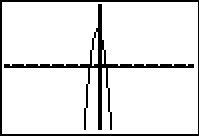
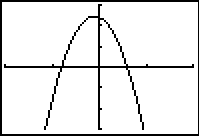
Show students several graphical displays for one function using different viewing windows and discuss why particular viewing windows are appropriate or inappropriate for showing key features of the function. For example, which of the displays below show the graph of a given quadratic function well? Discuss the expected number of intercepts and turning points and the nature of turning points as key features of the graphical display. This stresses the importance of careful selection of viewing window in the context of the function being considered and the questions being asked about it.
|
Standard or default viewing window -10 ≤ x ≤ 10 -10 ≤ y ≤ 10
|
Zoom In once from default viewing window -2.5 ≤ x ≤ 2.5 -2.5 ≤ y ≤ 2.5 |
|
Zoom Out once from default viewing window -40 ≤ x ≤ 40 -40 ≤ y ≤ 40 |
-10 ≤ x ≤ 10 -30 ≤ y ≤ 30 |
It is useful to provide examples where key features of graphs are not always apparent in the default viewing window. This allows for discussion of how the features of the graphics calculator can be used to find an appropriate display. One possibility could be to have students find a good viewing window using the zooming features only, or by adjusting the viewing window manually.
Viewing window affects gradients
The choice of viewing window affects the image displayed. In this case the choice of viewing window affects the visual steepness of the line y = x+1 when in actual fact the gradient is the same and it is just the scale that is different from one screen shot to the next. These types of displays can prompt discussion about the necessity to consider scale in any interpretation of a graphics calculator display.
|
-10 ≤ x ≤ 10 -10 ≤ y ≤ 10 |
-5 ≤ x ≤ 5 -10 ≤ y ≤ 10 |
|
-2 ≤ x ≤ 2 -10 ≤ y ≤ 10 |
-1 ≤ x ≤ 1 -10 ≤ y ≤ 10 |
| Four views of the graph of y = x+1 showing the effect of viewing window on apparent gradient. | |
Activity 2: Limitations of graphical displays
In this activity students explore the limitations of graphical displays.
Each graphics calculator will have a certain number of pixels that can be used. This affects the display of graphs and impacts on how smooth a curve will look.
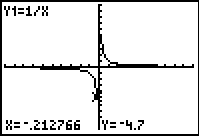
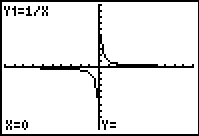
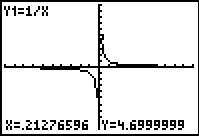
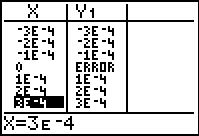
The displays below show the graph of y = 1/x on a graphics calculator set in the default viewing window (-10 ≤ x ≤ 10), where each x-increment is 20/94. When tracing along the curve it appears that there are no x-values between -0.212766 and 0, or between 0 and 0.21276596. This is due to the limitations of the graphical display and the fact that in the default viewing window each x-increment or 'step' is 20/94. It is useful to discuss the limitations of a display such as this and the fact that the permitted x -increment suggests that there aren't x -values close to zero, which is not correct. Students need to be aware that the displays shown may not be accurate representations and it is crucial that they are aware of key features of families of curves even if a graphics calculator is used to produce a display. It would also be possible to use simple functions such as linear or quadratic functions and to trace along the curve to show the same situation where the x-increment suggests discrete values along the x-axis, rather than an infinite number of points.
| width="95%" |
|
Cursor one step to the left of y-axis (ie press left arrow once). The viewing window is the default viewing window here. -10 ≤ x ≤ 10 and -10 ≤ y ≤ 10 |
 |
|
One step to the right (press right arrow once) the display indicates that x =0, but does not provide a y-value
|
 |
|
One step to the right (press right arrow once) the first x-value appears to be .21276596.
|
 |
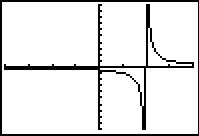
The second example is the graph of y = 1/(x − 2) shown below. Discussion of the expected shape of the curve and the existence of an asymptote at x = 2 is important so that students recognise that the line shown does represent an asymptote, but is just 'joining the dots'. The options for having curves with and without joined plotted points can be demonstrated.
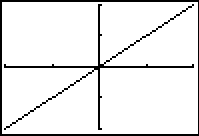
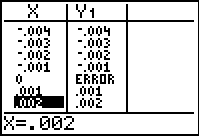
The third example shows how a graphical display might be misleading if there is a discontinuity. For example, x2/x is not defined at x = 0 but the graphical display shown does not show this. Moving to a table can confirm that x2 /x is not defined at x = 0.
 |
 |
 |
Activity 3: Tables and lists look similar but work differently
In this activity students develop an awareness that tables and lists are treated differently by most graphics calculators. An important thing here is to show the features of lists and tables that make them different and to discuss the differences.
Lists are used to work with data (which could itself be generated by a list). Once a list is entered, the user operates on the actual numbers in the list and the initial values don't change.
Tables hold values related to functions entered into the function editor. With a table, it is possible to work with a variety of (x, y) values by changing the x-starting value and the increment.
The differences between tables and lists can be demonstrated by using a data set in the list which looks the same as those generated in a table using a function.
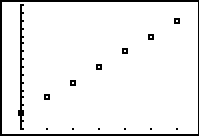
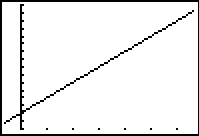
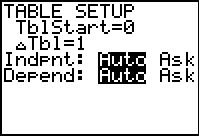
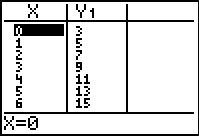
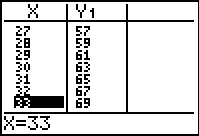
For example, consider the function y = 2x+3. Enter the function and then set up a table to display (x, y) coordinates. Students can produce a table of values for this function by setting up the table with a starting value of x=0 and an increment of 1, so the x-values increase by 1 each time. The graphics calculator generates the y-values in the table automatically, based on the function entered in Y1 in this case. It is possible for students to scroll down, for example, to the point x = 27 and the graphics calculator shows the associated (x, y) coordinate.
 |
 |
 |
Now students can enter the pairs (0, 3), (1, 5), (2, 7), (3, 9) (4, 11), (5, 13) and (6, 15) into two lists, copying the output of the table above. In this case the values shown are just numbers that have been entered, the list is not generated using a function and hence there is no possibility of extending the table eg to discover (7, 27) without typing it in.
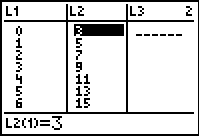
Students could also generate the L2 values by entering the L1 values and then using L2 = 2 × L1 + 3. It is important to note that even though the result appears to be the same as that obtained using the table, it is different. Students may think that L2 is related to L1, but values in L1 can be changed without a subsequent change in L2 values and vice-versa. The list does not operate like a table or a spreadsheet. The rule used to produce the L2 values only works at the time it is entered and individual values can be changed manually. For example, if the L1 value of 0 is replaced by 10 the L2 value of 3 does not change. Students might expect the value of 3 to change to 23 if they believe a list operates like a table. Examples to highlight the differences between lists and tables are useful to discuss.
In discussion, note that there are an infinite number of (x, y) coordinates potentially generated in the table, compared to the list which has a number of discrete points. Students can change the increment for the table to show that the values in the table are generated by the function based on the x-starting value and the increment.
Students can compare the graphs of the function and the data entered into the list. These two displays are shown below.
|
Graph from list |
Graph from function |
|
|
|
Activity 4: Numerical displays and rounding errors
Students need good number sense and estimation skills when working with graphics calculators in the same way that they do with scientific calculators.
On appropriate occasions, teachers should ensure that students become familiar with:
- different ways in which their calculator displays numbers
- the fact that only a limited (although large) number of digits is available for any number
- the importance of using the various sorts of memory available to minimise rounding errors.
How calculators display numbers
On graphics calculators, numbers can be written in normal decimal form, scientific and engineering notation and sometimes as fractions.
- The number 314 159 can be written like this in normal form, as 3.14159E5 in scientific notation (number between 1 and 10 and a power of ten), or as 314.159E3 in engineering notation (number between 1 and 1000 and a power of a thousand).
- These notations will be evident for very small and large numbers. For example, working out the powers of 2 eventually leads to 8589934592 but the next number on my calculator shows as 1.717986918E10.
- Inbuilt fraction conversion keys convert from a decimal output to a fraction output in some cases. This is not always possible with long numbers.
- When 2/3 is entered, the display shows 0.6666666667 and students need to be aware that this number is rounded. If students round the display further to 0.667 and then enter this into their calculator and ask for it as a fraction then they will get 667/1000, rather than the 2/3 they may have expected. On my graphics calculator, the number 0.6666666667 will not convert to a fraction.
Limited number of decimal places
Inside the calculator, only a limited (although large) number of digits is available for any number. This limits the size of large numbers that can be entered or calculated with, giving 'overflow error'. It also limits the accuracy of numbers of all sizes.
- A graphics calculator normally gives outputs in decimal form. For example, if 1/2 + 3/4 is entered, an output of 1.25 is obtained. This is an exact decimal answer, but usually the answer is a decimal approximation. If 1/3 is entered, the output is the decimal approximation 0.3333333333. Students who think this is an exact answer will often give as an answer, the output provided by the calculator to the level of accuracy the calculator display is set at, often ten decimal places.
- The limited number of places stored will sometimes provide unexpected outputs. For example, zero may be expected but an output such as 2.5E-15 may be obtained. On the other hand , e−1000 gives 0. Hopefully students would recognise that this number is very close to zero, but that it is not exactly zero. It is important to alert students to these possibilities and to discuss any unexpected numerical results.
- Some further examples to show the limitations on the size of numbers can be shown by entering 1099 × 10−99 = 1where the calculator can deal with the numbers entered, followed by 10100 × 10−100 where an error message is returned. Entering 1099 × 10−100 returns zero, rather than 0.1 which we would expect. My graphics calculator returns zero for 10−100 which is why the output of zero is given instead of 0.1.
Minimising rounding errors by using the memories
When students are carrying out multi-step calculations, they should use numbers stored in the calculator rather than retype numbers shown on the calculator display. Fewer digits are displayed than are retained internally, so using answers stored in the calculator gives more accurate results.
- A useful 'memory' device is the command ANS which recalls the previous output to full internal accuracy. If a student enters
 then a graphics calculator display shows 3.141592654. If the student now enters sin(Ans) the output will be 0, as expected. If the student instead chooses to enter sin(3.141592654) by retyping the number displayed for
  then the output will be -4.102E-10, a number which is very small, but not the expected 0.
 - If 1/(√2 − 1) − √ 2 is entered, the calculator will give 1, which is the exact value (although the calculator only knows that this is the answer to a very large number of decimal places). If instead the student entered √2 and then used the display from the calculator rather than √2 then they would get 1.000000003 rather than 1. The noticeable rounding error is a result of using the number displayed for √2, instead of the greater accuracy of the internal number.
There are three sorts of memory that students need to be aware of. Different brands of graphics calculators will have a selection of these:
- store command to assign an output to the memory, or
- Ans to recall the last output or
- select entries from the history.
Students need to be familiar with the way that their calculator memory facilities work to avoid re-entering numbers. Encourage students to store intermediate answers rather than to re-enter them so that they keep all of the decimal places in their calculations and do not make typing mistakes.
More on Modes and Long Numbers
Students can explore the different formats for displaying numbers in different modes. Ask students to enter the following numbers in different mode settings, corresponding to normal decimal notation, scientific notation and engineering notation.
- e−1000 gives 0 in decimal notation, 0E0 in scientific and 0E0 in engineering notation. All of these illustrate rounding error.
- 1020 × 1030 correctly gives 1E50 in decimal and scientific notation and 100E48 in engineering notation
- 10−20 × 10−30 gives 1E-50 in decimal, scientific notation and 10E-51 in engineering notation on my calculator (what does it do on yours?)
It is really important that students are exposed to unexpected calculator outputs and that they develop the ability to recognise limitations of technology. Discussion of different examples, such as those shown above will help students develop some awareness of the constraints of the technology they are using.
Activity 5: Match this picture
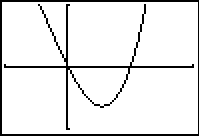
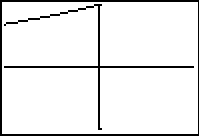
In this activity students have to choose appropriate viewing windows to replicate given displays of graphs of functions. Students can be provided with both familiar functions (linear and quadratic) and also functions that they might not be so familiar with, for example cubics or quartics.
The challenge here is to set a viewing window to produce the given visual display of the graph. There is no need to be precisely the same. The intention is to highlight that any visual display gives only a peek at the real infinite graph, and that the relative scales on the axes determine the visual slopes.
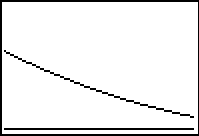
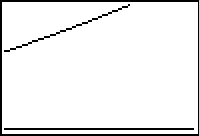
|
y=x(x-1)(x+2)
|
y=2.1 x
|
|
y=2x+3
|
y=2x+3
|
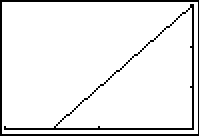
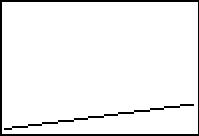
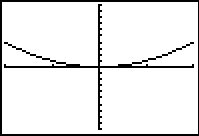
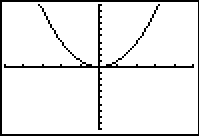
Students could also be asked to produce the following graphs of y = x² by choosing an appropriate viewing window. This emphasises that the choice of viewing window has a significant effect on the display.
|
|
|
|
|
|
Another interesting question is to ask what types of graphs CANNOT be produced by looking at y = x² through different viewing windows.
Making Up Questions
Students can also make up challenges for their classmates. They announce the rule for the function, show the display without indication of the viewing window, and challenge classmates to reproduce the visual effect. Classmates will need to select an appropriate part of the graph (e.g. showing or not showing a turning point), determine whether fine detail is to be shown or not (i.e. small or large viewing window) and adjust the horizontal and vertical scales to get appropriate visual gradients.

