Mathematics Developmental Continuum

Success depends on students being able to:
Whereas a linear function has a constant rate of growth, an exponential function has a constant percentage rate of growth. This means that the recursive rule is a constant multiplication (or division) instead of a constant addition (or subtraction).
This topic is quite difficult for students because the algebra differs so much from the familiar linear growth. The topic is also difficult because it requires a genuine understanding of the relationships between decimals, percentages and ratio.
Success depends on students being able to work confidently with percentages and decimals.
The formula for a percentage growth is A = (1 + d)x, where d is the decimal equivalent to the percentage.
For example for 12% growth over x time periods, A = 1.12x; for 10% growth over x time periods, A = 1.10x = 1.1x; for 5% growth, A = 1.05x , for 0.3% growth, A = 1.003x etc.
The fact that adding a percentage is multiplication, rather than addition, is very important in many circumstances.
An additional complication is working with decay. Just as the percentage growth, expressed as a decimal, is added for growth situations, it is subtracted for decay situations. But this makes the decimal look different. For example for 12% decay over x time periods, A = (1-0.12) x = 0.88x ; for 10% decay , A = (1 - 0.10)x = 0.9 x; for 5% decay, A = 0.95 x , for 0.3% decay, A = (1- 0.003)x = 0.997 x etc.
Exponential functions are very important because they apply to so many real world situations.
Students should be able to recognise that there is underlying constant percentage change in situations such as:
The underlying idea is number pattern and the different ways it can be summarised.
These four activities explore different aspects of the understanding required for this topic.
Activity 1: Exploring exponential growth aims for understanding of the relationship between the base number of the exponential expression (1 + g) and the percentage growth rate, g as a percentage.
Activity 2: Exploring exponential decay does the same but focuses on decay, where the decay rate is d, and the formula has (1 – d) as the base of the exponential expression.
Activity 3: Exponential decay on a guitar helps students to discover the exponential decay function of a normal guitar. No musical skill required, but a real guitar to look at would be helpful.
Activity 4: Fitting exponential functions to real data automatically shows how to use the curve fitting facility on a graphics calculator to fit exponential curves, which is particularly useful for data involving measurement error.
This activity, presented on the attached student resource sheet (Word - 143Kb), presents data tables that are very artificial, but designed to illustrate the properties of exponential functions easily. There are 4 tables of exponential data and their graphs. The investigation questions might be done either individually, or in groups.
|
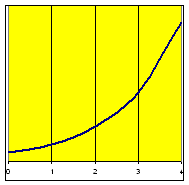
Sample Data Table A
|
 |
Activity 2, presented on the attached student resource sheet (Word - 130Kb), is similar to Activity 1, but deals with decay. The decay function is more tricky, because the decimal corresponding to the decay rate is subtraction, eg 10% decay has a base of 0.9 (= 1 – 0.1).
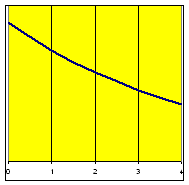
Sample Data Table E
|
 |
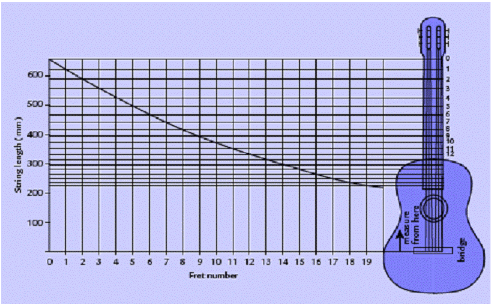
This activity, on the attached student resource sheet (Word - 459Kb) , uses real data of the lengths of string on a guitar for different notes, to show exponential decay in a real world situation. The graphs may be explored using a spreadsheet and/or graphics calculator. The data might be usefully compared to the same distances on a guitar in your classroom.
The frets on a guitar are placed so that they make the correct vibrating string length for the note of music. We are interested in how the vibrating string length changes for each fret position. The function is such at after 12 exponential reductions (one per fret) the string length reduces to half its open length. So b ^ 12 = 0.5. This makes b equal to the twelfth root of 0.5, or about 0.914. Some students might enjoy finding this ratio more accurately.
Spreadsheet: Guitar frets
The spreadsheet (Excel - 114Kb) offers three versions of the function:
Instructions
Open the spreadsheet. Choose one of the three options using the tabs at the base.
Try different numbers in the yellow box. The graph will adjust appropriately.
Activity 3 showed how to find an exponential function through real data, by calculating the constant ratio and starting value.
Sometimes it is appropriate to use the graphics calculator to find the equation. This is illustrated here with the guitar data for a TI-83 graphics calculator. Other calculators have similar facilities
To find a curve that goes through the points, use a regression function. Because we know this is exponential decay, use ExpReg.