Mathematics Developmental Continuum

Success with latitude and longitude depends on students being able to bring together knowledge from three sources: (i) geographical and scientific understanding of the world and its relationship to the sun, (ii) three dimensional spatial ability and (iii) mathematical understanding of the sphere, angles and lines.
At Level 5.5, students link latitude and longitude on maps with the associated lines on the sphere. They can find places from co-ordinates and vice versa. They have a basic understanding of the difficulties of representing the 3-D world on 2-D maps.
At Level 5.75 and beyond, students articulate the relationships between angles (e.g. latitude and direction of sun) in geometric terms, and relate these to the relative position of sun and earth. This requires strong 3-D spatial imagery.
A low level of understanding is exhibited by students who can find places on a map when given latitude and longitude co-ordinates, but cannot interpret these in terms of the world as a sphere, or link the information in the co-ordinates to physical consequences such as when it is day and night, when it is summer and winter etc.
A very high level of understanding is exhibited by students who can link the angle of latitude of a place to the angle of elevation of the sun at midday, and visualise why the elevation of the sun changes over the seasons.
Building up 3-D visualisation is a key here, so it is essential to have good models. In classrooms with a data projector, photos of models (supplied) can be used effectively along with internet animations and satellite photos. Use of real maps and other data-bases ensures that students gain useful skills for real life map reading. On the other hand, the ‘Map your own world’ activity presents students with a simplified task to highlight the mathematical relationships involved and to present a novel situation where students do not already know the answer.
Activity 1: Lines of latitude and longitude introduces key concepts with the use of 3-D models.
Activity 2: Map your own world focuses on the consequences of representing the 3-D earth’s surface on 2-D paper, by getting students to draw a map of a simplified world.
Activity 3: Shortest distances addresses an important feature of maps.
Activity 4: Latitude, longitude and the sun makes the crucial link between the mathematical co-ordinate system and the geographical reasons for its development.
Activity 5: Eastings and northings is an extension activity, which introduces a modern innovation in map co-ordinates, and makes links to basic Cartesian co-ordinate geometry
Activity 6: Investigative projects provides some suggestions for linking mathematics with other subjects.
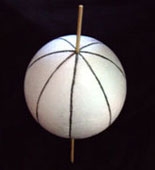
Three dimensional geometry is very hard to learn without physical models. Use a sphere to demonstrate lines of longitude (first) and latitude. Inexpensive polystyrene spheres of suitable dimensions are sold in craft shops. Put a skewer through the sphere to represent the axis around which the earth spins. Latitude and longitude (PPT - 800Kb) is also supplied, which will be especially useful for showing the cross-sections.
Step 1: The lines and their properties
Begin with lines of longitude. Students make a list of the properties of lines of longitude by looking at the model: they each join the north and south pole; they are all the same length; they form ‘great circles’ (i.e. the biggest circle that can be drawn on the sphere); if you cut the sphere through lines of longitude, the cross-section is a circle going through the centre of the earth; there are an infinite number of lines of longitude.
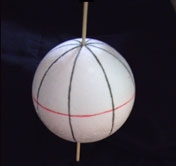
Draw the equator on the model. Students make a list of its properties by looking at the model: same length as the lines of longitude; perpendicular to all of them; if you cut the sphere through the equator, the cross-section is a circle going through the centre of the earth.
Draw some other lines of latitude on the model. Students make a list of their properties by looking at the model: all except the equator are shorter than the lines of longitude; perpendicular to the lines of longitude; if you cut the sphere through the equator, the cross-section is a circle; the equator is a special line of latitude; near the poles the lines become extremely short (zero length at the poles); there are an infinite number of lines of latitude.
|
|
|
|
Step 2: Labelling the lines
Demonstrate that if the lines are named or numbered, we could identify the exact location of any point on the earth (sphere) by giving its latitude and longitude.
Explain the labelling system:
Label some key lines on the sphere, and get students to identify where points are (e.g. lat 0 °, long 0 °, lat 0 °, long 90 °, approx position of Australia etc).
Students achieving level 5.5 understand these angles just as labels. Students achieving Level 5.75 can explain what angles are being measured.
Step 1: Look at map projections
Look at maps and note how the lines of latitude and longitude are drawn.
Mercator projections are the easiest to understand, and are suitable for students achieving Level 5.5. Lines of longitude are all parallel and ‘vertical’. Lines of latitude are all parallel and ‘horizontal’.

Step 2: Map your world
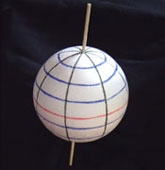
Make your own world by sticking or drawing some ‘countries’ on the polystyrene worlds you have made, or show the photo on the right (included in the PowerPoint show Latitude and longitude (PPT - 800Kb)). Students use large sized grid paper, to draw the map of this world in the Mercator projection, showing its 4 countries (Red, Purple, Light Green and Dark Green).
Discuss the correspondence between the ‘real’ countries’ and their representation on the map. For example, the two Greens look about the same size on the world, but not on the map; Red looks about the same east-west distance on the world and on the map, but Purple is the same on the world and different on the map.)
Note that most distortion occurs near the poles.
Repeat with a different set of countries if desired.
The figure below shows how students should draw the map grid for the Mercator projection (lines of latitude and longitude equally spaced, and then plot points on the boundaries of the countries. This work cannot be drawn very exactly (especially for the purple country) from this picture. It can be much more exact from a three dimensional model world.

Provide students with a globe of the world and photocopies of a common map of the world on which they can draw.
Students then find the shortest route to fly between cities on the globe (use a piece of string to test), and then to draw the corresponding route on the map. Examples: Auckland - Perth, New York - Tokyo, Melbourne – Tokyo, Singapore – Mexico City. Singapore – Bogota (Columbia), Cape Town – Athens.
Now students plot what looks like the shortest distance between pairs of cities on the map and trace it on the globe.
Students write answers to questions such as:
Latitude and longitude are not just co-ordinates for locating places on the surface of the earth. They have been selected because they describe the position of the earth relative to the sun. A student working at Level 5.75 will understand and be able to apply the following relationships.
Longitude
Latitude
The angle of latitude is at the centre of the earth. Latitude determines the angle of sun

These images are included on the PowerPoint show Latitude and Longitude (PPT - 800Kb).
Small sections of the earth can be thought of as being flat. A new system of co-ordinates, called Universal Transverse Mercator (UTM), divides the earth into separate zones, each of which get coordinates called eastings and northings that are like (x, y) coordinates. Victoria is in zones 55 and 54. The coordinates are given in metres from an origin, with axes pointing east-west and north-south. The GPO in the centre of Melbourne is located at 320 725 E and 5812 900 N.
Street directories, some maps, Global Positioning systems, and Google Earth now give both latitude and longitude and eastings and northings. Students can find eastings and northings for their local areas, and calculate distances as below.
|
|
Old Melbourne Observatory |
RMIT |
|
Latitude |
37° 49' 45.89894" S |
37° 48' 28.97789" S |
|
Longitude |
144° 58' 31.20632" E |
144° 57' 48.23014" E |
|
Easting (Zone 55) m |
321 819.584 E |
320 717.187 E |
|
Northing (Zone 55) m |
5 811 180.035 N |
5 813 528.197 N |
Because eastings and northings are in metres, we can see that RMIT is 2348.162 metres (5814528.197 - 5811180.035) north of the old observatory. This is a bit over 2 km.
Similarly RMIT is 1102.397m less East of the observatory (i.e., about 1 km west).
Using Pythagoras’ theorem, the distance between the two points is 2594 m.
The topic of latitude, longitude and coordinate systems is an excellent one for investigative projects, which can combine mathematics, geography, science, navigation and history. Examples include the problems of navigation, the history of maps, the properties of different types of maps, how maps are made, rotation of the earth, time zones, global positioning systems, the seasons, etc.